Monthly Archives: December 2019

Ranking Property Taxes on the 2020 State Business Tax Climate Index

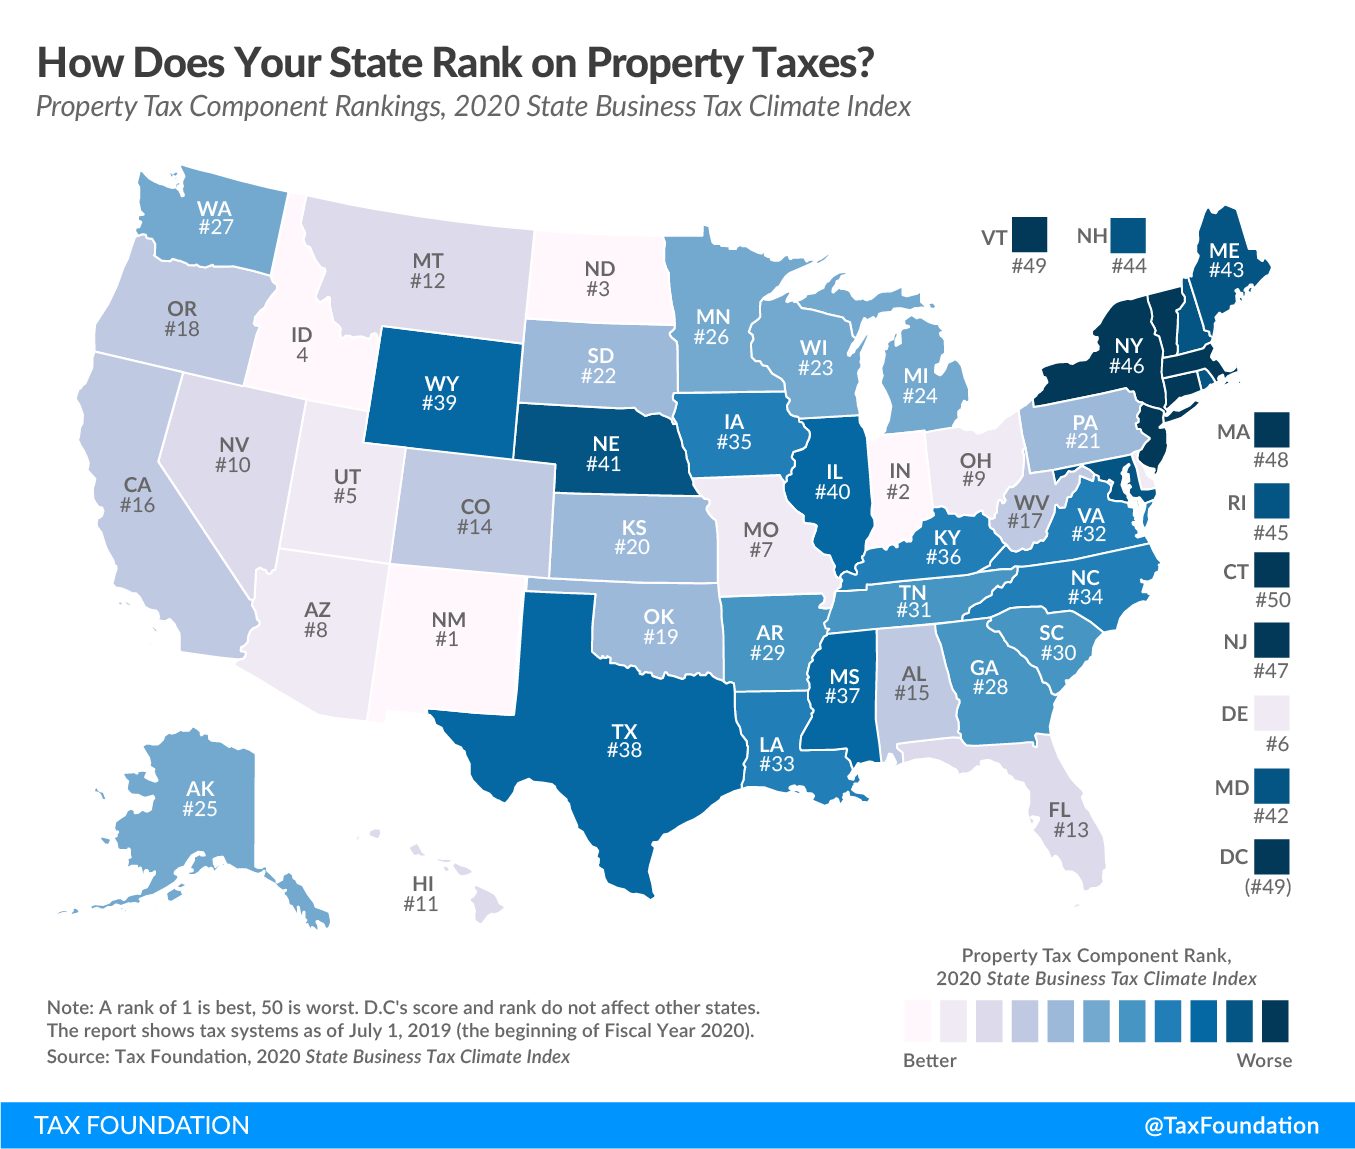
Today’s map shows states’ rankings on the property tax component of the 2020 State Business Tax Climate Index. The Index’s property tax component evaluates state and local taxes on real and personal property, net worth, and asset transfers. The property tax component accounts for 16.6 percent of each state’s overall Index score.

Property taxes matter to businesses for several reasons. First, businesses own a significant amount of real property, and tax rates on commercial property are often higher than the rates on comparable residential property. Many states and localities also levy taxes not only on the land and buildings a business owns but also on tangible property, such as machinery, equipment, and office furniture, as well as intangible property like patents and trademarks. Across the nation, property taxes impose one of the most substantial state and local tax burdens most businesses face. In fiscal year 2018, taxes on real, personal, and utility property accounted for 38 percent of all taxes paid by businesses to state and local governments, according to the Council on State Taxation.

Although taxes on real property tend to be unpopular with the public, a well-structured property tax generally conforms to the benefit principle (the idea in public finance that taxes paid should relate to benefits received) and is more transparent than most other taxes.

Taxes on intangible property, wealth, and asset transfers, on the other hand, are harmful and distortive. States that levy such taxes—including capital stock taxes, inventory and intangible property taxes, and estate, inheritance, gift, and real estate transfer taxes—are less economically attractive, as they create disincentives for investment and encourage businesses to make choices based on the tax code that they would not make otherwise. Businesses with valuable trademarks may seek to avoid headquartering in states with intangible property taxes, and shipping and distribution networks might be shaped by the presence or absence of inventory taxes.

States are in a better position to attract business investment when they maintain competitive real property tax rates and avoid harmful taxes on tangible personal property, intangible property, wealth, and asset transfers. This year, the states with the best scores on the property tax component are New Mexico, Indiana, North Dakota, Idaho, Utah, and Delaware. States with the worst scores in this component are Connecticut, Vermont, Massachusetts, New Jersey, New York, and Rhode Island, plus the District of Columbia.

Best and worst property tax codes in the country. See full state property tax code rankings in 2019.

Explore Our Interactive Tool

To gauge whether your state’s property tax structure has become more or less competitive in recent years, see the table below.

Property Tax Component of the State Business Tax Climate Index (2017–2020)
Note: A rank of 1 is best, 50 is worst. All scores are for fiscal years. DC’s score and rank do not affect other states.

Source: Tax Foundation.

State 2017 Rank 2018 Rank 2019 Rank 2020 Rank Change from 2019 to 2020
Alabama 18 12 16 15 1
Alaska 24 38 25 25 0
Arizona 6 6 6 8 -2
Arkansas 25 22 29 29 0
California 17 13 15 16 -1
Colorado 16 14 14 14 0
Connecticut 50 49 50 50 0
Delaware 11 20 7 6 1
Florida 13 10 13 13 0
Georgia 23 23 27 28 -1
Hawaii 9 16 11 11 0
Idaho 3 3 5 4 1
Illinois 41 45 40 40 0
Indiana 4 4 3 2 1
Iowa 35 39 35 35 0
Kansas 21 19 20 20 0
Kentucky 37 36 36 36 0
Louisiana 32 30 33 33 0
Maine 43 41 42 43 -1
Maryland 44 42 43 42 1
Massachusetts 47 46 48 48 0
Michigan 26 21 24 24 0
Minnesota 29 28 26 26 0
Mississippi 36 35 37 37 0
Missouri 7 7 8 7 1
Montana 12 9 12 12 0
Nebraska 40 40 41 41 0
Nevada 10 8 10 10 0
New Hampshire 42 44 44 44 0
New Jersey 49 50 47 47 0
New Mexico 1 1 1 1 0
New York 45 47 46 46 0
North Carolina 33 32 34 34 0
North Dakota 2 2 2 3 -1
Ohio 8 11 9 9 0
Oklahoma 14 15 19 19 0
Oregon 19 18 17 18 -1
Pennsylvania 22 33 22 21 1
Rhode Island 46 43 45 45 0
South Carolina 27 24 30 30 0
South Dakota 20 25 21 22 -1
Tennessee 31 29 31 31 0
Texas 38 37 38 38 0
Utah 5 5 4 5 -1
Vermont 48 48 49 49 0
Virginia 30 31 32 32 0
Washington 28 27 28 27 1
West Virginia 15 17 18 17 1
Wisconsin 34 26 23 23 0
Wyoming 39 34 39 39 0
District of Columbia 48 46 49 49 0

To learn more about how we determined these rankings, read our full methodology here.

Avalara’s Annual Sales Tax Report Highlights Major Changes for Nexus and Marketplace Law in 2020

SEATTLE, WA — December 11, 2019 — Avalara, Inc. (NYSE: AVLR), a leading provider of cloud-based tax compliance automation for businesses of all sizes, today released its fifth annual sales tax changes report. Key findings in the report point to the continued impact of economic nexus laws, escalating tensions around marketplace facilitator laws, an increase in online cross-border sales, and the growing role of technology in tax compliance heading into 2020.

In today’s global, omnichannel business landscape, accurate sales tax collection and remittance are essential for businesses of all sizes seeking to stay compliant and competitive. Avalara’s 2020 sales tax changes report reveals major changes in legislation and consumer preference that are poised to disrupt ecommerce in 2020.

“2019 was another landmark year for sales tax in the United States with broad adoption of economic nexus and marketplace facilitator laws,” said Scott Peterson, vice president of U.S. tax policy and government relations at Avalara. “As 2020 progresses, we can expect to see more changes take place domestically and abroad in the form of marketplace laws and global compliance. This report should serve as a resource for business leaders and tax professionals to better understand the tax landscape and make more informed decisions that keep businesses compliant and improve efficiency.”

  • Many states are approaching remote sales tax differently. Economic nexus is old news and the new norm, but businesses continue to struggle with understanding their liability in each state and how to craft their tax strategies accordingly.
  • Economic nexus laws will continue to change. Louisiana is set to begin enforcing economic nexus by July 2020. A bill recently filed in Florida, if approved, will make the Sunshine State the 44th state to adopt economic nexus. If passed, Missouri will then be the only state outside of those with no general sales tax that has yet to enact a similar rule.
  • Marketplace facilitator laws are creating a “Wayfair 2.0” scenario. More than 36 states have adopted marketplace facilitator laws that require online marketplaces to collect and remit sales tax on behalf of third-party sellers. But, major marketplaces aren’t accepting this without a fight. For example, Amazon is “vigorously” fighting a sales tax assessment for marketplace sales tax in South Carolina. Other states, like Hawaii and North Carolina, are expected to enact marketplace sales tax laws in 2020.
  • International selling will take center stage and bring new challenges. Forecasted to reach $1 trillion in sales by 2020, by 2022, cross-border ecommerce sales could account for more than 15% of the world’s online retail market. Major events around the globe will impact international gain for businesses, including Brexit, fraud, global marketplace laws, and shifting tariffs.
  • Technology is responding to growing sales tax complexity. Artificial intelligence, big data analytics, and cloud computing are expected to reach a tipping point for practical application for sales tax in 2020. States are also embracing technology with 24 states participating in the Streamlined Sales Tax (SST) program and providing tax technology to businesses at no cost.

For additional information on state sales tax changes, please visit the Avalara sales tax rates resource. For more information on marketplace facilitator laws, please visit the Avalara state-by-state marketplace facilitator guide.

Download the 2020 sales tax changes report here.

Corporate Tax Rates around the World, 2019

Key Findings

  • In general, large industrialized nations tend to have higher statutory corporate income tax rates than developing countries.
  • The worldwide average statutory corporate income tax rate, measured across 176 jurisdictions, is 24.18 percent. When weighted by GDP, the average statutory rate is 26.30 percent.
  • Europe has the lowest regional average rate, at 20.27 percent (25.13 percent when weighted by GDP). Conversely, Africa has the highest regional average statutory rate, at 28.45 percent (28.15 percent weighted by GDP).
  • The average top corporate rate among EU countries is 21.77 percent, 23.59 percent in OECD countries, and 27.65 percent in the G7.
  • The worldwide average statutory corporate tax rate has consistently decreased since 1980, with the largest decline occurring in the early 2000s.
  • The average statutory corporate tax rate has declined in every region since 1980.

Introduction

In 1980, corporate tax rates around the world averaged 40.38 percent, and 46.67 percent when weighted by GDP.[1] Since then countries have recognized the impact that high corporate tax rates have on business investment decisions so that in 2019, the average is now 24.18 percent, and 26.30 when weighted by GDP, for 176 separate tax jurisdictions.

Declines have been seen in every major region of the world including in the largest economies. The 2017 tax reform in the United States brought the statutory corporate income tax rate from among the highest in the world closer to the middle of the distribution. Whereas in 2017 the United States had the fourth highest corporate income tax rate in the world,[3] it now ranks towards the middle of the countries and tax jurisdictions surveyed.

European countries tend to have lower corporate income tax rates than countries in other regions, and many developing countries have corporate income tax rates that are above the worldwide average.

Today, most countries have corporate tax rates below 30 percent.

The Highest and Lowest Corporate Tax Rates in the World[4]

The majority of the 218 separate jurisdictions surveyed for the year 2019 have corporate tax rates below 25 percent and 111 have tax rates between 20 and 30 percent. The average tax rate among the 218 jurisdictions is 22.79 percent.[5] The United States has the 84th highest corporate tax rate with a combined statutory rate of 25.89 percent.

The 20 countries with the highest statutory corporate income tax rates span every region, albeit unequally. While nine of the top 20 countries are in Africa, Europe appears only twice and Asia once. Of the remaining jurisdictions, one is in Oceania, and eight are in the Americas.[6]

The only countries with large economies in the top 20 are France (34.43 percent) and Brazil (34 percent).

Table 1: 20 Highest Statutory Corporate Income Tax Rates in the World, 2019
Note: The table includes 21 jurisdictions because Cameroon, Colombia, Saint Kitts and Nevis, and the Seychelles all have the same tax rate.

*The United Arab Emirates is a federation of seven separate emirates. Since 1960, each emirate has the discretion to levy up to a 55 percent corporate tax rate on any business. In practice, this tax is mostly levied on foreign banks and petroleum companies. For more information on the taxation system in the United Arab Emirates, see PwC, “Worldwide Tax Summaries – Corporate income tax (CIT) rates.”

Sources: OECD, “Table II.1. Statutory corporate income tax rate,” updated April 2019, https://stats.oecd.org/index.aspx?DataSetCode=Table_II1; KPMG, “Corporate tax rates table,” https://home.kpmg/xx/en/home/services/tax/tax-tools-and-resources/tax-rates-online/corporate-tax-rates-table.html; and researched individually, see .

Country Continent Rate
United Arab Emirates* Asia 55%
Comoros Africa 50%
Puerto Rico North America 37.5%
Suriname South America 36%
Chad Africa 35%
Democratic Republic of the Congo Africa 35%
Equatorial Guinea Africa 35%
Guinea Africa 35%
Kiribati Oceania 35%
Malta Europe 35%
Saint Martin (French Part) North America 35%
Sint Maarten (Dutch part) North America 35%
Sudan Africa 35%
Zambia Africa 35%
France Europe 34.43%
Brazil South America 34%
Venezuela (Bolivarian Republic of) South America 34%
Cameroon Africa 33%
Colombia South America 33%
Saint Kitts and Nevis North America 33%
Seychelles Africa 33%

On the other end of the spectrum, the 20 countries with the lowest non-zero statutory corporate tax rates all charge rates lower than 15 percent. Eleven countries have statutory rates of 10 percent, six being small European nations (Andorra, Bosnia and Herzegovina, Bulgaria, Gibraltar, Kosovo, and Macedonia). The only two major industrialized nations[7] represented among the bottom 20 countries are Ireland and Hungary. Ireland is known for its low 12.5 percent rate, which has been in place since 2003. Hungary reduced its corporate income tax rate from 19 to 9 percent in 2017.[8]

Table 2. 20 Lowest Statutory Corporate Income Tax Rates in the World, 2019 (Excluding Jurisdictions with a Corporate Income Tax Rate of Zero Percent)
Note: Table includes 21 jurisdictions because Cyprus, Ireland, and Liechtenstein all have the same tax rate.

Sources: OECD, “Table II.1. Statutory corporate income tax rate”; KPMG, “Corporate tax rates table”; and researched individually, see Tax Foundation, “worldwide-corporate-tax-rates/.”

Country Continent Rate
Barbados North America 5.5%
Uzbekistan Asia 7.5%
Turkmenistan Asia 8%
Hungary Europe 9%
Montenegro Europe 9%
Andorra Europe 10%
Bosnia and Herzegovina Europe 10%
Bulgaria Europe 10%
Gibraltar Europe 10%
Kosovo, Republic of Europe 10%
Kyrgyzstan Asia 10%
Nauru Oceania 10%
Paraguay South America 10%
Qatar Asia 10%
The former Yugoslav Republic of Macedonia Europe 10%
Timor-Leste Oceania 10%
China, Macao Special Administrative Region Asia 12%
Republic of Moldova Europe 12%
Cyprus Europe 12.5%
Ireland Europe 12.5%
Liechtenstein Europe 12.5%

Of the 218 jurisdictions surveyed, 13 currently do not impose a general corporate income tax. All these jurisdictions are small, island nations. A handful, such as the Cayman Islands and Bermuda, are well-known for their lack of corporate taxes. Bahrain has no general corporate income tax but has a targeted corporate income tax on oil companies.[9]

Table 3. Countries without General Corporate Income Tax, 2019
Sources: OECD, “Table II.1. Statutory corporate income tax rate”; KPMG, “Corporate tax rates table”; and researched individually, see Tax Foundation, “worldwide-corporate-tax-rates.”
Country Continent
Anguilla North America
Bahamas North America
Bahrain Asia
Bermuda North America
British Virgin Islands North America
Cayman Islands North America
Guernsey Europe
Isle of Man Europe
Jersey Europe
Saint Barthelemy North America
Turks and Caicos Islands North America
Vanuatu Oceania
Wallis and Futuna Islands Oceania

Regional Variation in Corporate Tax Rates

Corporate tax rates can vary significantly by region. Africa has the highest average statutory corporate tax rate among all regions, at 28.45 percent. Europe has the lowest average statutory corporate tax rate among all regions, at 20.27 percent.

When weighted by GDP, South America has the highest average statutory corporate tax rate at 32.01 percent. Europe has the lowest weighted average statutory corporate income tax, at 25.13 percent.

In general, larger and more industrialized nations tend to have higher corporate income tax rates than smaller nations. These rates are often above the worldwide average. The G7, which is comprised of the seven wealthiest nations in the world, has an average statutory corporate income tax rate of 27.65 percent, and a weighted average rate of 27.22 percent. OECD member states have an average statutory corporate tax rate of 23.59 percent, and a rate of 26.53 percent when weighted by GDP. The BRICS[10] have an average statutory rate of 27.40 percent, and a weighted average statutory corporate income tax rate of 26.52 percent.

Table 4. Average Corporate Tax Rate by Region or Group, 2019
Sources: Statutory corporate income tax rates are from OECD, “Table II.1. Statutory corporate income tax rate”; KPMG, “Corporate tax rates table”; and researched individually, see Tax Foundation, “worldwide-corporate-tax-rates.” GDP calculations are from the U.S. Department of Agriculture, “International Macroeconomics Data Set.”
Region Average Rate Average Rate Weighted by GDP Number of Countries Covered
Africa 28.45% 28.15% 49
Asia 21.32% 26.08% 46
Europe 20.27% 25.13% 39
North America 25.85% 26.26% 22
Oceania 23.75% 29.74% 8
South America 27.63% 32.01% 12
G7 27.65% 27.22% 7
OECD 23.59% 26.53% 36
BRICS 27.40% 26.52% 5
EU 21.77% 25.95% 28
G20 27.11% 26.94% 19
World 24.18% 26.30% 176

Distribution of Corporate Tax Rates[11]

Very few tax jurisdictions impose a corporate income tax at statutory rates greater than 35 percent. The following chart shows a distribution of corporate income tax rates among 218 jurisdictions in 2019. A plurality of countries (111 total) impose a rate between 20 and 30 percent. Twenty-four jurisdictions have a statutory corporate tax rate between 30 and 35 percent. Seventy-nine jurisdictions have a statutory corporate tax rate lower than 20 percent, and 190 jurisdictions have a corporate tax rate below 30 percent.

Figure 1.

Distribution of Worldwide Corporate Tax Rates in 2019

The Decline of Corporate Tax Rates Since 1980

Over the past 39 years, corporate tax rates have consistently declined on a global basis. In 1980, the unweighted average worldwide statutory tax rate was 40.38 percent. Today, the average statutory rate stands at 24.18 percent, representing a 40 percent reduction over the 39 years surveyed.[12]

The weighted average statutory rate has remained higher than the simple average over this period. Prior to U.S. tax reform in 2017, the United States was largely responsible for keeping the weighted average so high, given its relatively high tax rate, as well as its significant contribution to global GDP. Figure 2 shows the significant impact the change in the U.S. corporate rate had on the worldwide weighted average. The weighted average statutory corporate income tax rate has declined from 46.67 percent in 1980 to 26.30 percent in 2019, representing a 44 percent reduction over the 39 years surveyed.

Over time, more countries have shifted to taxing corporations at rates lower than 30 percent, with the United States following this trend with its tax changes at the end of 2017. This changing distribution of corporate tax rates has been far from consistent. The largest shift occurred between 2000 and 2010, with 77 percent of countries imposing a statutory rate below 30 percent in 2010 and only 41 percent of countries imposing a statutory rate below 30 percent in 2000.[13]

All regions saw a net decline in average statutory rates between 1980 and 2019. The average declined the most in Europe, with the 1980 average of 44.6 percent dropping to 20.27 percent, representing almost a 55 percent rate reduction. South America has seen the smallest decline, with the average only decreasing by 25 percent, from 36.66 percent in 1980 to 27.63 percent in 2019.

Africa, Oceania, and South America all saw periods where the average statutory rate increased, although the average rates decreased in all regions over the full period. In each instance of an average rate increase, the change was relatively small, with the absolute change being less than 2 percentage points between decades.

Figure 2.

Statutory weighted and unweighted corporate income tax rates from 1980 to 2019

The following map illustrates the global trend towards lower corporate income tax rates. Of the 138 jurisdictions for which the dataset includes the statutory income tax rates for both the years 2000 and 2019, only six countries have increased their rates during that time frame: Chile (from 15 percent to 25 percent), the Dominican Republic (from 25 percent to 27 percent), El Salvador (from 25 percent to 30 percent), Hong Kong (from 16 percent to 16.5 percent), Lebanon (from 10 percent to 17 percent), and Papua New Guinea (from 25 percent to 30 percent). Nineteen jurisdictions have the same corporate income tax rate in 2019 as in 2000, and 113 jurisdictions have decreased their rates over that time period.

Figure 3

Corporate tax trends around the world, corporate income tax trends around the world

Figure 4

Distribution of worldwide statutory corporate income tax rates, 1980-2019

Figure 5

Distribution of worldwide statutory corporate income tax rates from 1980-2019

Conclusion

Worldwide and regional average top corporate tax rates have declined over the last decades, with most countries following the trend. Of 138 jurisdictions around the world, only six have increased their corporate income tax rates between 2000 and 2019, while nineteen have not changed their rates, and 113 have decreased them. The trend would seem to be continuing, as several countries are planning to reduce their corporate tax rates in the coming years.[14]


Appendix

The Dataset

Scope

The dataset compiled for this publication includes the 2019 statutory corporate income tax rates of 218 sovereign states and dependent territories around the world. Tax rates were researched only for jurisdictions that are among the almost 250 sovereign states and dependent territories that have been assigned a country code by the International Organization for Standardization (ISO). As a result, zones or territories that are independent taxing jurisdictions but do not have their own country code are not included in the dataset.

In addition, the dataset includes historic statutory corporate income tax rates for the time period 1980 to 2018. However, these years cover tax rates of fewer than 218 jurisdictions due to missing data points.

To be able to calculate average statutory corporate income tax rates weighted by GDP, the dataset includes GDP data for 176 jurisdictions. When used to calculate average statutory corporate income tax rates, either weighted by GDP or unweighted, only these 176 jurisdictions are included (to ensure the comparability of the unweighted and weighted averages).

Definition of Selected Corporate Income Tax Rate

The dataset captures standard top statutory corporate income tax rates levied on domestic businesses. This means:

  • The dataset does not reflect special tax regimes, including but not limited to patent boxes, offshore regimes, or special rates for specific industries.
  • A number of countries levy lower rates for businesses below a certain revenue threshold. The dataset does not capture these lower rates.
  • A few countries levy gross revenue taxes on businesses instead of corporate income taxes. Since the tax rates of a corporate income tax and a gross revenue tax are not comparable, these countries are excluded from the dataset.

Sources

Tax Rates for the Year 2019

For OECD countries, the statutory corporate income tax rates used are the combined corporate income tax rates provided by the OECD; see OECD, “Table II.1. Statutory corporate income tax rate,” updated April 2019, https://stats.oecd.org/index.aspx?DataSetCode=Table_II1. The main source for non-OECD jurisdictions are the statutory rates provided by KPMG; see KPMG, “Corporate tax rates table,” 2019, https://home.kpmg/xx/en/home/services/tax/tax-tools-and-resources/tax-rates-online/corporate-tax-rates-table.html. Jurisdictions that are not part of either source were researched individually. The source for each of these jurisdictions is listed in a GitHub repository; see Tax Foundation, “worldwide-corporate-tax-rates,” GitHub, https://github.com/TaxFoundation/worldwide-corporate-tax-rates.

Tax Rates for the Years 1980-2018

Tax rates for the time frame between 1980 and 2018 are taken from a dataset compiled by the Tax Foundation over the last years. These historic rates come from multiple sources: PwC, “Worldwide Tax Summaries – Corporate Taxes,” 2010-2018; KPMG, “Corporate Tax Rate Survey,” 1998- 2003; KPMG, “Corporate tax rates table,” 2003-2018; EY, “Worldwide Corporate Tax Guide,” 2004-2018; OECD, “Historical Table II.1 – Statutory corporate income tax rate,” 1999, http://www.oecd.org/tax/tax-policy/tax-database.htm#C_CorporateCaptial; the University of Michigan – Ross School of Business, “World Tax Database,” https://www.bus.umich.edu/otpr/otpr/default.asp; and numerous government websites.

Gross Domestic Product (GDP) for the years 1980-2019

GDP calculations are from the U.S. Department of Agriculture, “International Macroeconomics Data Set,” December 2018, https://www.ers.usda.gov/data-products/international-macroeconomic-data-set/.


[1] Unless otherwise noted, calculated averages of statutory corporate income tax rates only include jurisdictions for which GDP data is available for all years between 1980 and 2019. For 2019, the dataset includes statutory corporate income tax rates of 218 jurisdictions, but GDP data is available for only 176 jurisdictions, reducing the number of jurisdictions included in calculated averages to 176. For years prior to 2019, the number of countries included in calculated averages varies by year due to missing corporate tax rates; that is, the 1980 average includes statutory corporate income tax rates of 74 jurisdictions compared to 176 jurisdictions in 2019.

[2] Statutory corporate income tax rates are from OECD, “Table II.1. Statutory corporate income tax rate,” updated April 2019, https://stats.oecd.org/index.aspx?DataSetCode=Table_II1; KPMG, “Corporate tax rates table,” https://home.kpmg/xx/en/home/services/tax/tax-tools-and-resources/tax-rates-online/corporate-tax-rates-table.html; and researched individually, see Tax Foundation, “worldwide-corporate-tax-rates,” GitHub, https://github.com/TaxFoundation/worldwide-corporate-tax-rates. GDP calculations are from the U.S. Department of Agriculture, “International Macroeconomics Data Set,” December 2018, https://www.ers.usda.gov/data-products/international-macroeconomic-data-set/.

[3] Kari Jahnsen and Kyle Pomerleau, “Corporate Income Tax Rates around the World, 2017,” Tax Foundation, Sept. 7, 2017, https://taxfoundation.org/corporate-income-tax-rates-around-the-world-2017/.

[4] As no averages are presented in this section, it covers all 218 jurisdictions for which 2019 corporate income tax rates were found (thus including jurisdictions for which GDP data was not available).

[5] This average is lower than the average of the 176 jurisdictions because many of the jurisdictions for which no GDP data is available are small economies with low corporate income tax rates.

[6] Although called the “top 20 rates,” they include 21 jurisdictions because Cameroon, Colombia, Saint Kitts and Nevis, and the Seychelles all have the same corporate income tax rate of 33 percent.

[7] Major industrialized nations are those that are members of the OECD.

[8] Although called the “bottom 20 rates,” they include 21 jurisdictions because Cyprus, Ireland, and Liechtenstein all have the same tax rate.

[9] This tax rate can be as high as 46 percent. See Deloitte, “International Tax – Bahrain Highlights,” last updated April 2019, https://www2.deloitte.com/content/dam/Deloitte/global/Documents/Tax/dttl-tax-bahrainhighlights-2019.pdf.

[10] BRICS is a group of countries with major emerging economies. The members of this group are Brazil, Russia, India, China, and South Africa.

[11] As no averages are presented in this chapter, it covers all 218 jurisdictions for which 2019 corporate income tax rates were found (thus including jurisdictions for which GDP data was not available).

[12] Historical data comes from multiple sources: PwC, “Worldwide Tax Summaries – Corporate Taxes,” 2010-2018; KPMG, “Corporate Tax Rate Survey,” 1998- 2003; KPMG, “Corporate tax rates table,” 2003-2018; EY, “Worldwide Corporate Tax Guide,” 2004-2018; OECD, “Historical Table II.1 – Statutory corporate income tax rate,” 1999, http://www.oecd.org/tax/tax-policy/tax-database.htm#C_CorporateCaptial; the University of Michigan – Ross School of Business, “World Tax Database,” https://www.bus.umich.edu/otpr/otpr/default.asp; and numerous government websites.

[13] This section of the report covers all 218 jurisdictions for which 2019 corporate income tax rates were found (thus including jurisdictions for which GDP data was not available).

[14] Daniel Bunn, “Upcoming Corporate Tax Rate Reductions in Developed Countries,” Tax Foundation, Sept. 13, 2018, https://taxfoundation.org/upcoming-corporate-tax-rate-reductions-developed-countries/.

Economic nexus bill introduced in Missouri

Last year at this time, Missouri lawmakers introduced a couple of bills relating to remote sales tax. Both sought to implement economic nexus, requiring out-of-state vendors with a certain amount of sales in the state to collect and remit sales tax. And both would require marketplace facilitators to handle sales tax on behalf of their third-party sellers. Neither made it into law.

Missouri legislators are trying again this year. Senate Bill 529 would:

  • Impose a use tax collection obligation on remote vendors with at least $100,000 in cumulative gross receipts from the sale of tangible personal property in the state in the previous 12-month period (effective October 1, 2020)
  • Require marketplace facilitators meeting the above threshold to register with the Missouri Department of Revenue and collect and remit sales and use tax on direct and third-party sales in the state (by January 1, 2022)
  • Require the Missouri Department of Revenue to create and maintain a mapping feature for use tax information
  • Require the Missouri Department of Revenue to provide and maintain a downloadable electronic database of taxing jurisdiction boundary changes and tax rates

The sales and use tax system in Missouri is incredibly complex: There are more than 2,200 local tax jurisdictions, each of which may have multiple sales and use tax rates (e.g., a general rate, a rate for food, a rate for domestic utilities, etc.); it’s extremely difficult to determine the correct rate because special tax jurisdictions overlap; and rates change frequently.

The mapping and database requirements SB 529 would impose on the Department of Revenue would ease the burden of collection, a bit.

SB 529 is substantially similar to its predecessor, SB 189, which had a good deal of support. According to the fiscal estimate, SB 189 would have generated between $93.3 million and $142.5 million in total state sales and use tax revenues. However, the Department of Revenue noted that actual collections may have been less because “the collectability of sales taxes on remote sellers is an unknown, particularly for sellers outside the United States.”

Missouri is one of only two states that has a statewide sales tax but doesn’t impose a sales tax collection obligation on out-of-state sellers. The other is Florida, which is also considering a tax on remote sales. The remaining 43 states and the District of Columbia have all adopted economic nexus, though Louisiana isn’t yet enforcing it. Most states also require marketplaces to collect and remit sales tax for third-party sellers.

A tax on remote internet sales is even moving forward at the local level in Alaska, which has no general sales tax but does permit localities to levy a local sales tax.

Will 2020 be the year online sales get taxed in Missouri? It’s too soon to say, but there’s widespread support for the idea. Missouri Governor Mike Parson told The Associated Press in December 2018, “I think we should collect that, and I think we will eventually collect that.”

Learn more about existing remote sales tax laws in Avalara’s state-by-state guide to economic nexus laws and state-by-state guide to marketplace facilitator laws.

Kansas Tax Modernization: A Framework for Stable, Fair, Pro-Growth Reform

Introduction

Kansas achieved a history of tax reform success throughout the 19th and 20th centuries, as evidenced by the dramatic evolution of Kansas’ code over the state’s 158-year history. The result is the current tax code, constructed primarily upon a relatively balanced three-legged stool of property, sales, and income taxes. While the majority of Kansans we met with are proud of the state’s three-legged tax structure, they also agreed that the time has come to build upon this structure and achieve lasting tax reform for the 21st century. The purpose of this book is to serve as a guide on Kansas’ path to tax reform.

In the course of producing the research for this book, we conducted dozens of interviews across the state, discussing tax reform options with hundreds of Kansans with an interest in tax reform. Several themes arose consistently in our meetings with citizens and stakeholders across Kansas. Those themes include an aspiration to make the state more competitive while ensuring stability, a willingness to learn from the past coupled with a desire to step forward into a better future, and a hunger for a thoughtful and comprehensive look at improving Kansas’ tax code. Kansans we met with carry a shared desire for a balanced conversation to achieve successful tax reform for the people and businesses that call Kansas home.

It is our goal to meet these demands with the work contained in this book, and by serving as an educational resource for the people of Kansas. We seek to apply the lessons of Kansas’ past, take a thoughtful and comprehensive look at Kansas’ tax code, and be a resource for modernizing Kansas’ tax code for the 21st century.

In the introductory text below, we summarize the recent history of Kansas’ tax changes and then lay out our objectives and guiding principles for thinking about tax reform. In the Executive Summary we list the building blocks with which Kansas can construct an enhanced, simplified, modernized tax code. The first two chapters of this book look at Kansas’ economy and budget. Chapters 3-7 build out the details to explain the building blocks of tax reform, with a view to creating structural improvements across the code over coming years.

Finally, we pledge to serve as a resource to lawmakers and stakeholders across Kansas as they fit and mortar together these building blocks into the architecture of comprehensive tax reform.

Synopsis of Kansas’ Recent Tax Changes

Few subjects are as fraught as is tax reform in Kansas. Unfortunately, “Kansas” has become a byword in many quarters, shorthand for the dramatic fight over what has been dubbed the “Kansas tax experiment” and its consequences. Although many of the tax changes adopted in 2012 and subsequent years have since been reversed, the issue remains fresh for many—and unresolved.

Some proponents of the 2012 tax changes feel that the efforts were cut short, or that tax changes were not allowed to proceed as intended. Many opponents feel that the reversals to date are incomplete. What cannot be disputed is that the past few years have been tumultuous, and that few policymakers would care to repeat that experience.

Kansas’ tax rate cuts that began in 2012 reduced revenues without commensurate reductions in expenditures to the point that the state struggled to meet its obligations. Reducing the tax wedge can certainly promote economic growth, but such growth is not sufficient to close the resulting revenue gap. Businesses became understandably wary about Kansas’ fiscal instability. When the state could neither meet its obligations within given revenues nor reduce expenditures in kind, it became inevitable that the tax changes begun in 2012 would be reversed, as they approximately were in 2017.

The tax debate that took course over the last several years is still raw for many Kansans.

The 2012 tax changes yielded uncertainty rather than greater competitiveness. The changes might well have kept business investment at bay, not because companies don’t like lower taxes—they do—or don’t have increased investment opportunities when tax burdens are lower—again, they do—but because they understood that the situation was unsustainable.

The 2012 tax changes were mostly focused on rates, not structure. The signature structural change from the 2012 law, the exemption of pass-through income from the individual income tax, was nonneutral in that it favored certain sorts of economic activity over others and created opportunities for tax arbitrage. Suddenly, a dentist’s income was likely to be tax-exempt, but her hygienist’s income was not. An independent consultant to corporations incurred no individual income tax liability in Kansas, but someone performing the same job responsibilities but as a corporate employee paid full freight.

The subsequent reversals were not particularly attentive to structural improvements either, focused as they were on fiscal sustainability. Retroactive tax rate increases were enacted to close the revenue gap. Policymakers pushing the rollback and rate increases were impelled by a sense of urgency, and doubtless believed that it was no time to undertake a broad tax study.

So why even consider tax reform?

Because, in short, addressing the structural inadequacies of Kansas’ tax code is now more important than ever. In recent years, Kansas policymakers have cut rates and they have raised them. They have created exemptions and repealed them. What they have not done is take a serious look at the actual scaffolding upon which the tax code is built and considered a plan to improve that scaffolding for a 21st century economy.

Now that the dust has begun to settle, the time has come to review the tax code, not with an eye either to slim or to grow revenues—the optimal revenue target is a policy choice outside the scope of this project—but to make sure that the state is raising the revenue it needs in the most neutral, efficient, transparent, and pro-growth way possible. It’s time to ask what’s working and what isn’t—to evaluate whether incentives are achieving their objectives, to identify ways to reduce compliance costs, and to better align the tax code to promote economic growth.

Furthermore, there is an issue at stake beyond simply reforming Kansas’ tax code. The Sunflower State’s brand will gain as much as its tax code from a successful tax reform. Kansans can come together, put the past behind them, and build a better future. The purpose of this book is to provide the tools and trajectory for the structure of Kansas’ tax code to be significantly improved. This book will address how those revenues should and should not be collected, and we leave it to Kansans to decide how much revenue should be collected.Our Purpose

To be clear: this is not a book about tax cuts. All else being equal, lower rates and lower tax burdens will incentivize investment and spur economic growth. However, the real world is complex, and all else is not always equal, in particular in a state that has undergone the significant tax and revenue changes Kansas has enacted since 2012. Regardless of how much revenue will be collected, Kansas can modernize the structure of its tax code to ensure that collections are made in a way that will encourage growth.

It’s time to turn the page on the debates of the past decade and chart a new course, one that makes Kansas a different kind of watchword. We are excited by the prospect that, a few years hence, “Kansas” will cease to be a word of warning and instead be a word that connotes reform and renewal. In recent years many states, including regional competitors like Iowa and Indiana, have modernized their tax codes to become more competitive and are enjoying the benefits of those reforms. It is time for Kansas to join their ranks. Wherever you stood in 2012 and wherever you are now, if you believe that Kansans deserve better than the state’s current tax code, this book is for you.

The following pages contain both an analysis of the state’s tax code and concrete recommendations for improving it. We will begin with the corporate tax code, given that the corporate tax is Kansas’ most inefficiently structured major tax, and therefore offers the greatest opportunity for reform and renewal.

We hope that you will find yourself agreeing with many of the recommendations in this book, but perhaps you will disagree with a few of them as well. We are eager to begin a robust and bipartisan conversation about modernizing Kansas’ tax code to suit a 21st century economy. Imagine a world where people talk about the lessons learned in Kansas that illuminated the path to Kansas’ modernized tax code and reinvigorated future. We’re imagining it. We invite you to join us.

A Menu of Tax Reform Solutions

Corporate Income Tax

Kansas’ income tax is functionally a two-rate tax, with most corporate income taxed at 7 percent. Some firms face little or no liability under the corporate income tax, but for others, structural deficiencies in the state’s approach to corporate taxation can lead to uncompetitive burdens and penalize in-state investment. Our recommendations would create a more neutral corporate tax environment which encourages long-term investment in the state.

Removing International Income from the Tax Base. Inaction on the part of policymakers has Kansas poised to tax international income, with corporations potentially facing significant in-state liability for the activities of their foreign subsidiaries or related corporations, which would make Kansas far less attractive to multinational corporations. Lawmakers should reaffirm the state’s traditional position (in line with other states) of not taxing international income.

Locking in Full Expensing of Capital Investment. Commendably, Kansas conforms to the new federal policy of allowing corporations to fully deduct the cost of their machinery and equipment purchases in the first year. But with the current federal treatment scheduled to expire, Kansas would be well-advised to lock in the current system, decoupling from future changes to federal law and instead providing permanent full expensing.

Repealing the Throwback Rule. Kansas’ throwback rule punishes businesses that sell out of state, encouraging them to relocate to—or at least locate distribution facilities in—other states. With studies suggesting that, over time, tax avoidance strategies eliminate most or all revenue gains from throwback rules, repealing the throwback rule would be a sound investment in Kansas’ economy.

Shifting to Market Sourcing of Service Income. Kansas’ tax code treats companies more favorably when they produce and sell tangible goods than when they sell services or other intangibles. This distinction lacks economic justification and should be eliminated.

Conforming to Federal Treatment of Net Operating Losses. Federal law now provides for unlimited net operating loss carryforwards, capped at 80 percent of tax liability in any given year, while Kansas offers a relatively stingy 10-year carryforward. Policymakers might consider increasing the length of the carryforward period, or, alternatively, conforming to federal treatment for simplicity’s sake.

Reviewing Business Tax Incentives. A growing number of states have established panels, commissions, or ad hoc committees to review tax incentives periodically. With a new tax incentives database in the works, policymakers should formalize a regular evaluation process to assess the return on investment from the state’s economic development incentives.

Individual Income Tax

Kansas’ individual income tax is in the middle of the pack for rates and collections, but opportunities exist for structural improvements affecting individuals and pass-through businesses. The state’s failure to respond to changes in the federal tax code, moreover, yields higher taxes on many Kansans, an unlegislated and nonneutral tax increase that policymakers may wish to address. Our recommendations are focused on creating a more regionally competitive individual income tax.

Indexing Income Tax Provisions for Inflation. To avoid bracket creep, where inflation leads to greater income tax liability even when real income remains constant, Kansas should index the major provisions of its individual income tax—the brackets, standard deduction, and personal exemption—to inflation.

Enhancing the Standard Deduction. Because it is not inflation-indexed, Kansas’ $3,000 standard deduction has lost half its value since it was created in 1988, an erosion even more notable now that the federal standard deduction stands at $12,400. Kansas also offers both marriage bonuses and penalties in its standard deduction, with a joint filer deduction of $7,500 (more than double the single filer deduction), but a $700 per person or $850 per couple additional deduction for senior citizens. Kansas policymakers should consider increasing the standard deduction and eliminating these bonuses and penalties.

Allowing an Independent Choice of Itemization. Under the new federal tax law, far more taxpayers find it advantageous to take the more generous federal standard deduction than to itemize, but this decision currently increases their Kansas tax liability, creating an unlegislated tax increase. Kansans should be allowed to itemize on their state return even if they claim the standard deduction on their federal return.

Rolling Back Excessive Credits. Some of Kansas’ tax incentives are barely claimed at all, and others fall far short of their objectives, but they create administrative costs by their mere existence. While individual income tax credits only carve out the tax base slightly, a cleanup of the existing credit structure is appropriate.

Eliminating the Social Security Tax Cliff. Kansas excludes Social Security from the taxable income of those whose federal adjusted gross income is $75,000 or under, but taxes it in full once a taxpayer earns a single additional dollar. Policymakers should explore the implantation of a gradual phaseout of the benefit to avoid this steep tax cliff.

State and Local Sales Taxes

Kansas’ sales tax is imposed on a narrow base that exempts many goods and most services, a holdover from an earlier era, while the state’s approach to remote sales tax collections raises serious legal questions and imposes significant compliance costs. Our proposals would simplify and modernize the sales tax, bringing it in line with today’s economy.

Broadening the Sales Tax Base. A well-structured sales tax applies to all final consumer purchases, both goods and services, while exempting business inputs. Kansas’ sales tax falls far short of this goal, and in an increasingly service-oriented economy, it erodes further each year. We offer a menu of base-broadening options to enhance the stability of the sales tax and generate additional revenue that could be used to reduce the sales tax rate or pay down reforms elsewhere.

Excluding Business Inputs. Kansas policymakers have long recognized the importance of excluding business inputs from the sales tax base to avoid pyramiding, but little progress has been made in expanding the scope of these important exemptions. Policymakers should consider exemption certificates and the adoption of better definitions of business inputs to reduce the impact of this hidden tax.

Removing Barriers to Interstate Commerce. Nearly all states have responded to their newfound authority to require collection and remittance of tax on remote sales, but Kansas is alone in imposing these requirements without a safe harbor for small sellers, which is likely unconstitutional. Policymakers should enact legislation providing such a safe harbor, disavowing retroactive collections, providing clear statutory language regarding marketplace facilitators, and eliminating its legally dubious click-through and affiliate nexus provisions.

Property and Related Taxes

Kansas’ property tax ranks above average in its structure, and the state has a laudable system of property tax administration. Further improvements can be made that will benefit homeowners and businesses. Property tax controls can be improved to increase transparency and taxpayer involvement in the process of increasing property taxes. The property tax base should be focused on land and its improvements, insofar as possible, and the administration of property taxation for retail properties should be improved. Finally, Kansans should thoughtfully study and consider options for consolidating local governments.

Restructure Property Tax Lid in the Mold of Utah’s “Truth in Taxation” Requirements. Kansas passed a property tax lid into law in 2015. It took effect in 2017. The lid has caused dissatisfaction with both local government officials and advocates of property tax restraints. Kansans can restructure this lid in the mold of Utah’s Truth in Taxation law, creating a property tax cap system that thoroughly informs and engages property owners in any decision to increase property taxes while not unduly constraining local governments.

Reduce Reliance on Tangible Personal Property Taxes with Potential Offsets. Kansas’ taxation of tangible personal property is a nonneutral and inefficient part of its property tax code. Kansas has recently moved to exempt various forms of business tangible personal property from taxation and should continue to move forward in removing all tangible personal property from the tax code, thus circumscribing the property tax to land and its improvements.

Preempt Local Governments on Taxation of Gross Earnings from Intangible Property. The local taxation of earnings from intangible personal property is one of the more peculiar and anachronistic provisions of Kansas’ property tax code. This tax is levied by a small share of local governments. The state legislature should preempt the taxation of earnings from intangible personal property.

Direct County Appraisers on Proper Methodologies for Appraising Big-Box Retail Properties. The volatile appraisals of big box retail properties cause instability for both businesses and local governments. However, the Kansas Board of Tax Appeals and Supreme Court have consistently ruled that retail properties should be appraised on the value of their land and improvements, and that appraisal formulae should not be based upon the income-potential or lease-potential of a retail property. The Director of the Division of Property Valuation should thus provide clear guidance to county appraisers for valuing big-box retail properties.

Revisit the Requirement for Partial Payment of Tax that Is under Appeal. Kansas can also reconsider the requirement for the payment of the disputed portion of a tax that is under appeal. This change would improve Kansas’ property tax administration, and if structured properly, reduce volatility for local government finances that is the result of disputed appraisals.

Study and Consider Ways to Achieve Local Government Consolidation. Kansas should formalize an effort to study the need for local government consolidation and consider options for the same. Local government consolidation frequently arose in our discussion of property taxes across the state. However, such changes require a careful, well-thought analysis of where opportunities exist to improve the efficiency of local governance through consolidation.

Other Tax and Revenue Considerations

Although income, sales, and property taxes make up the bulk of state and local taxes in Kansas, other taxes (like excise and severance taxes), as well as revenue- and budget-related provisions like the Budget Stabilization Fund, merit consideration. Our recommendations promote certainty and stability for the state and taxpayers alike.

Shoring up the Rainy Day Fund. Kansas was one of the last states to implement a rainy day fund, with the 2016 enactment of legislation creating the Budget Stabilization Fund. Currently, however, deposits are only required for a few years, the calculation of mandatory deposits is fairly arbitrary, there are no specifications of when funds may be withdrawn, and there is no replenishment provision for when a withdrawal has been made. If the rainy day fund is to provide a buffer in the next recession, policymakers must establish it on a firmer basis.

Maintaining the “Border War” Truce. Kansas and Missouri recently implemented a ceasefire in the “border wars” in which both sides offered incentives to lure companies back and forth across the border dividing Kansas City, Kansas from Kansas City, Missouri. This truce is not binding on localities, however, so policymakers should do what is in their power to encourage or induce local governments not to defect.

Above is a brief excerpt from Kansas Tax Modernization: A Framework for Stable, Fair, Pro-Growth Reform. To download our full reform guide, click the link below.

Download The Full Book

Stay Informed on Tax Policy Research and Analysis

What’s on the Tax Policy Agenda at the EU

This month a new five-year term for the European Commission began. Now led by President Ursula von der Leyen, the Commission has a broad agenda including several tax policy proposals, many carried over from the previous Commission. These include policies that would change the taxation of large multinationals corporations, and digital services, and target carbon emissions.

Common Corporate Tax Base (CCTB)

The CCTB is a proposal to adopt a uniform corporate tax base at the EU level potentially alongside a system of formulary apportionment. The policy has been under debate for several years and there are ongoing discussions on both technical and political fronts. One key question that remains unresolved is whether to apply the uniform corporate tax base to both large multinational companies and smaller companies that operate across borders.

As with any tax base, the CCTB would set standards for capital allowances, losses, inventory treatment, and other key elements of defining income. Because corporate tax bases vary so widely across Europe, the European Commission faces a serious challenge in finding political agreement on a tax base that is dramatically different than the tax base in some countries.

Additionally, there is disagreement about whether the CCTB should be paired with a minimum corporate tax rate for the EU.

Digital Services Tax (DST)

In 2018, the Commission proposed a DST across the EU. Negotiations led to a stalemate earlier this year, and since that time several European countries have been working to adopt a DST unilaterally. The new Commission will continue to work on the DST proposal.

The proposal that was left on the table would apply a 3 percent tax on revenues of certain large multinationals that provide online advertising services, online marketplaces, and sales of data. France adopted such a tax in the summer of 2019, and because the policy mainly targets U.S. companies, the U.S. has been exploring retaliatory tariffs in response to the DST.

The new Commission has directly connected the status of the EU DST to the ongoing efforts at the OECD on the taxation of the digitalized economy. If an international agreement is not reached at the OECD in 2020, the Commission will restart work on the DST.

Updates to Value-Added Taxes (VAT)

Over the decades, one of the most significant roles for the European Commission in tax policy has been in managing the rules for the EU VAT system. Recently, much of the work has been focused on modernizing the system, coordinating reduced rates, and simplifying the system. Key areas of work including e-commerce, VAT rates reform, and technical challenges associated with the overall system.

Current proposals on VAT rates include requiring that any member state’s weighted average VAT rate exceeds 12 percent and creating a list of goods that should always be taxed at the standard VAT rate (rather than a reduced rate). On simplification and e-commerce, the Commission will continue to work out permanent solutions to many transitional rules that were adopted recently.

European Green Deal

A new initiative for this Commission is to pursue several policies focused on the environment under the umbrella of a European Green Deal. On tax policy, this includes the challenge of working out the feasibility of a carbon border tax which would tax the carbon content in imports to the EU. Additionally, the European Energy Tax Directive (a policy that governs taxation of fuel and electricity in the EU) will likely be reformed to expand the scope of that directive. In general, the policy will likely mean heavier taxes on some sources of energy (such as kerosene) or types of travel (such as aviation).

Qualified Majority Voting (QMV)

Tax files at the European Commission currently require unanimity for adoption; however, some countries have complained that the procedural barrier this creates is unnecessary. Instead, some countries would like to have tax files be decided by a qualified majority or 55 percent of member states representing at least 65 percent of the EU population.

A shift from unanimity to QMV would likely change the outcome for debates over CCTB and the DST (if that policy is revisited). Other tax policy debates that were moved away from universal adoption (like Financial Transaction Taxes) could be reconsidered in light of the changed procedure.

However, unanimity would be required to move to QMV, so countries that strongly oppose the various proposals that could become EU policy under QMV would likely also oppose the procedural change.

Conclusion

The new European Commission has a significant amount of tax policy work currently on the agenda. There are opportunities for simplification and others for creating new, distortionary taxes. Although the path to agreement and implementation on any of these policies may be challenging, policymakers should be careful to consider how the various policies will impact economic outcomes in the EU.

Comparing Wealth Taxation and Income Taxes

The wealth tax has been pushed to the forefront of tax policy debates to combat wealth inequality. Presidential candidates Senator Elizabeth Warren (D-MA) and Senator Bernie Sanders (I-VT) both released proposals to tax the rich as part of their 2020 platforms. Senator Warren’s tax plan features a wealth tax rate of 2 percent each year on wealth over $50 million and 6 percent on wealth over $1 billion as part of her Medicare for All plan. Senator Sanders proposed a more progressive wealth tax of up to 8 percent on net wealth over $10 billion.

Wealth taxes are not well-known to taxpayers in the United States. In the current tax system, property taxes and the estate tax are special cases of wealth tax, although property taxes are commonly used at the state level. Annual comprehensive wealth taxes have never been implemented in the United States. Individual income taxes have been a main source of U.S. federal revenue for decades.

It is easier for us to understand the basics of a wealth tax when we compare it to the individual income tax.

Tax Base

Wealth taxes are imposed on individual’s net wealth, or the market value of their total owned assets minus liabilities. Wealth taxes can be narrowly or widely defined, and depending on the definition of wealth, the base for a wealth tax can vary. For example, Senator Warren proposed a broad-based wealth tax plan, applying to both domestic and foreign assets of U.S. citizens.

Economists Emmanuel Saez and Gabriel Zucman, who have consulted with presidential candidates on their tax plans, define net wealth as financial and nonfinancial assets net debts, including bonds and mutual funds, pensions, housing, public equity, and private business assets, but excluding human capital, durable goods, nonprofits, and unfunded defined benefit pension plans.

Countries in the Organisation for Economic Cooperation and Development (OECD) with a net wealth tax adopt different wealth tax bases. For example, France, Spain, and Sweden exempt business assets from their wealth tax due to the concern of discouraging productive investments.

The U.S. federal income tax system is based on the Haig-Simmons income definition. The income tax base is defined as current consumption and the increase in one’s net worth during that year (with some exceptions like IRAs). Labor and capital income are the two major components of the income tax base. Labor income includes salaries, wages, and fringe benefits; capital income includes dividends, interest, and capital gains income.

More simply, wealth taxes are levied on the wealth stock, or the total amount of net wealth a taxpayer owns, while an income tax is imposed on the flow from the wealth stock. The income earned from returns to wealth becomes part of the wealth tax base for the next year, as the wealth stock grows.

Differences in Taxing Capital Income

The current income tax system on capital gains is levied when a gain is realized, meaning capital gains taxes are only collected when assets are sold and there is a gain between the time they are purchased and sold. Unrealized capital gains are not taxed, as the tax is deferred until they are realized. Wealthy people tend to defer realizing capital gains; the top 1 percent holds about half of the unrealized capital gains. This is one reason some argue that the wealthy do not pay enough in tax.

A wealth tax would theoretically reduce deferral and lock-in incentives, since wealth would be taxed on an accrual basis rather than realization basis. The accrual basis means that accrued gains and principal assets are taxed on a yearly basis instead of when the gains and assets are sold or realized. If the market value of assets and liabilities are properly and regularly valued, the wealth tax will be levied on the market value of capital assets on a yearly basis. However, the small number of countries with wealth tax experience shows that the wealth tax is not an efficient way to raise revenue due to the administrative difficulties and disappointing levels of revenue collection.

Understanding the Size of Wealth Tax Rates

A wealth tax levied at a low rate may hide the real size of the effect on after-tax return. Consider a taxpayer who owns corporate bonds with a fixed return of 5 percent each year. The asset is valued at $50 million at the beginning of the year. Starting from Year 1, the return from this asset will be counted as asset appreciation and taxed as capital income at the end of the year. In this case, a levy of a 1 percent wealth tax is equivalent to a 20 percent income tax; both would leave the taxpayer and government in the same place for taxes paid and revenue collected, as shown in the table below. In this example, we assume there is no overlap between these taxes. If the wealth tax were enacted at 5 percent, it would be equal to a 100 percent income tax, which is a zero after-tax return.

Source: Author’s calculations.
Wealth Tax Income Tax
Net Assets ($millions) 50 50
Rate of Return 5% 5%
Tax Rate 1% 20%
Revenue 0.5 0.5

Interactions between Income Taxes and A Wealth Tax

If established, a wealth tax would become a new, separate tax system in addition to the income tax. The interaction between wealth taxes and income taxes is worth thinking through.

An increase in the income tax rate will reduce the wealth tax base, which is calculated as subtracting income tax liability from current assets if we assume income tax is imposed before the wealth tax.

On the other hand, a wealth tax will reduce the stock of income-generating assets if no return to these assets comes in. When the return to capital is considered, net wealth assets may still grow if the return to wealth is larger than the wealth tax levy. If the wealth tax levy is greater than the return to wealth, the wealth stock declines, resulting in lower income generation.

In the table below, Scenarios A and B display how wealth levels and the after-tax return will change under a 1 percent wealth tax and a 6 percent wealth tax. Under Scenario B, the after-tax return becomes negative, as the 6 percent wealth tax exceeds the before-tax rate of return of 5 percent. This reduces wealth accumulation and may lower the amount of assets businesses might have available and erode the wealth tax base.

Scenario A Year 1 Year 2 Year 3
Wealth Tax Rate 1% 1% 1%
Assets ($millions), beginning of year 50 51.48 53.00
Before-tax Return 5% 5% 5%
Income Tax Base 2.50 2.57 2.65
Capital Income Tax (20%) 0.50 0.51 0.53
Wealth Tax Base ($millions) 52.00 53.54 55.12
Wealth Tax 0.52 0.54 0.55
After-tax return 3.0% 3.0% 3.0%
Scenario B Year 1 Year 2 Year 3
Wealth Tax Rate 6% 6% 6%
Assets ($millions), beginning of year 50 48.88 47.79
Before-tax Return 5% 5% 5%
Income Tax Base 2.50 2.44 2.39
Capital Income Tax (20%) 0.50 0.49 0.48
Wealth Tax Base ($millions) 52.00 50.84 49.70
Wealth Tax 3.12 3.05 2.98
After-tax return -2.2% -2.2% -2.2%
Source: Author’s calculations.

Conclusion

An annual comprehensive wealth tax has never been adopted in the U.S. If enacted, it will be a separate tax structure from the current federal tax system. Wealth taxes are levied on the wealth stock on an accrual basis, while income taxes are levied on the flow from the wealth stock. A low wealth tax rate is equivalent to a high-rate income tax. The interaction between wealth taxes and the existing income taxes must be considered when analyzing a wealth tax plan.

American Catalog Mailers Association building case against Wayfair decision

The American Catalog Mailers Association (ACMA) is building a case against South Dakota v. Wayfair, Inc., the June 2018 decision by the Supreme Court of the United States that allows states to tax remote sales. If it can gather enough evidence, the ACMA will bring the case to Capitol Hill.

In an email sent to retailers last month, the group requested “detailed accounts” of remote sellers’ efforts to comply with varying state sales tax rules: “ACMA needs multiple case studies that can be taken to the Hill demanding attention and action from Congress.” The goal? Convince Congress to “rein in the states and address sellers’ concerns.”

It seems the ACMA won’t ask Congress to prohibit the taxation of remote sales. With 42 states and the District of Columbia already requiring out-of-state sellers to collect and remit sales tax, that ship has sailed. Rather, it’s seeking “restrictions on states’ remote sales tax rules.”

Different product taxability definitions and rules, various sales tax holidays, and other aspects of state sales tax laws make compliance burdensome and costly for out-of-state businesses. The ACMA wants “considerable simplifications so our members and other remote sellers can handle this properly.”

Yet the ACMA acknowledges that some states, particularly the 23 members and one associate member of the Streamlined Sales and Use Tax Agreement (SST), have taken steps to reduce the complexity and cost of compliance for remote sellers. SST states provide centralized tax administration, uniform product definitions, audit protection for certain remote sellers, and more. They also encourage the use of sales tax software, like Avalara AvaTax; sales tax software can greatly reduce the burden and cost of sales tax compliance.

In fact, businesses that qualify as a volunteer seller in SST states are eligible to receive the services of a Certified Software Provider (CSP) for free or at a reduced cost. Though it isn’t an SST state, Pennsylvania offers a similar CSP program; several other states are developing CSP programs of their own.

It will be interesting to see if the ACMA obtains enough evidence to ask Congress to limit state taxing authority. In the meantime, businesses have no choice but to comply with it as required by state law.

For a deeper understanding of the remote sales tax requirements sellers must contend with, see our seller’s guide to nexus laws and sales tax collection requirements.

Marketplace facilitators: Prepare to collect Michigan sales tax on third-party sales

Michigan has required certain remote sellers to collect and remit sales tax since October 1, 2018. Now it’s looking to codify that requirement and expand it to marketplace facilitators.

Michigan Department of Treasury Revenue Administrative Bulletin 2018-16 requires businesses with no physical presence in the state to register with the tax department, collect and remit sales or use tax, and file returns if, in the previous calendar year, the seller has:

  • More than $100,000 in taxable or non-taxable sales into the state, or
  • At least 200 separate taxable or non-taxable transactions

Both House Bill 4542 and House Bill 4543 would codify that requirement retroactively to October 1, 2018. They would also require remote marketplace facilitators with economic nexus to collect and remit sales tax on their direct and third-party sales. When calculating the threshold, marketplace facilitators and marketplace sellers would both have to include direct sales and marketplace sales. It’s unclear when the obligation for marketplace facilitators would take effect.

There are slight differences between the bills. HB 4542 applies only to sellers of tangible personal property, while HB 4543 applies to sellers of tangible personal property or taxable services. The threshold in HB 4542 is based only on sales to purchasers, while the threshold in HB 4543 is based on sales for storage, use, or consumption in the state.

House Bill 4540 and House Bill 4541 would establish a sales tax collection requirement for marketplace facilitators but wouldn’t codify economic nexus for remote sellers. Both measures would take effect January 1, 2020.

The only difference between the two bills is that HB 4541 explicitly excludes lodging and telecommunications marketplaces from the definition of “marketplace facilitator.”

The legislative analysis provides a summary and comparison of the bills, which were all unanimously approved by the House and Senate and currently sit on Governor Gretchen Whitmore’s desk. If any are enacted as written, marketplace facilitators could need to collect and remit tax on behalf of marketplace sellers as early January 1, 2020.

In addition to Washington, D.C., 43 states have economic nexus and 37 have a sales tax collection requirement for marketplace facilitators. Get the details for each in our state-by-state guide to economic nexus and state-by-state guide to marketplace facilitator laws.

Capital Gains Taxes in Europe

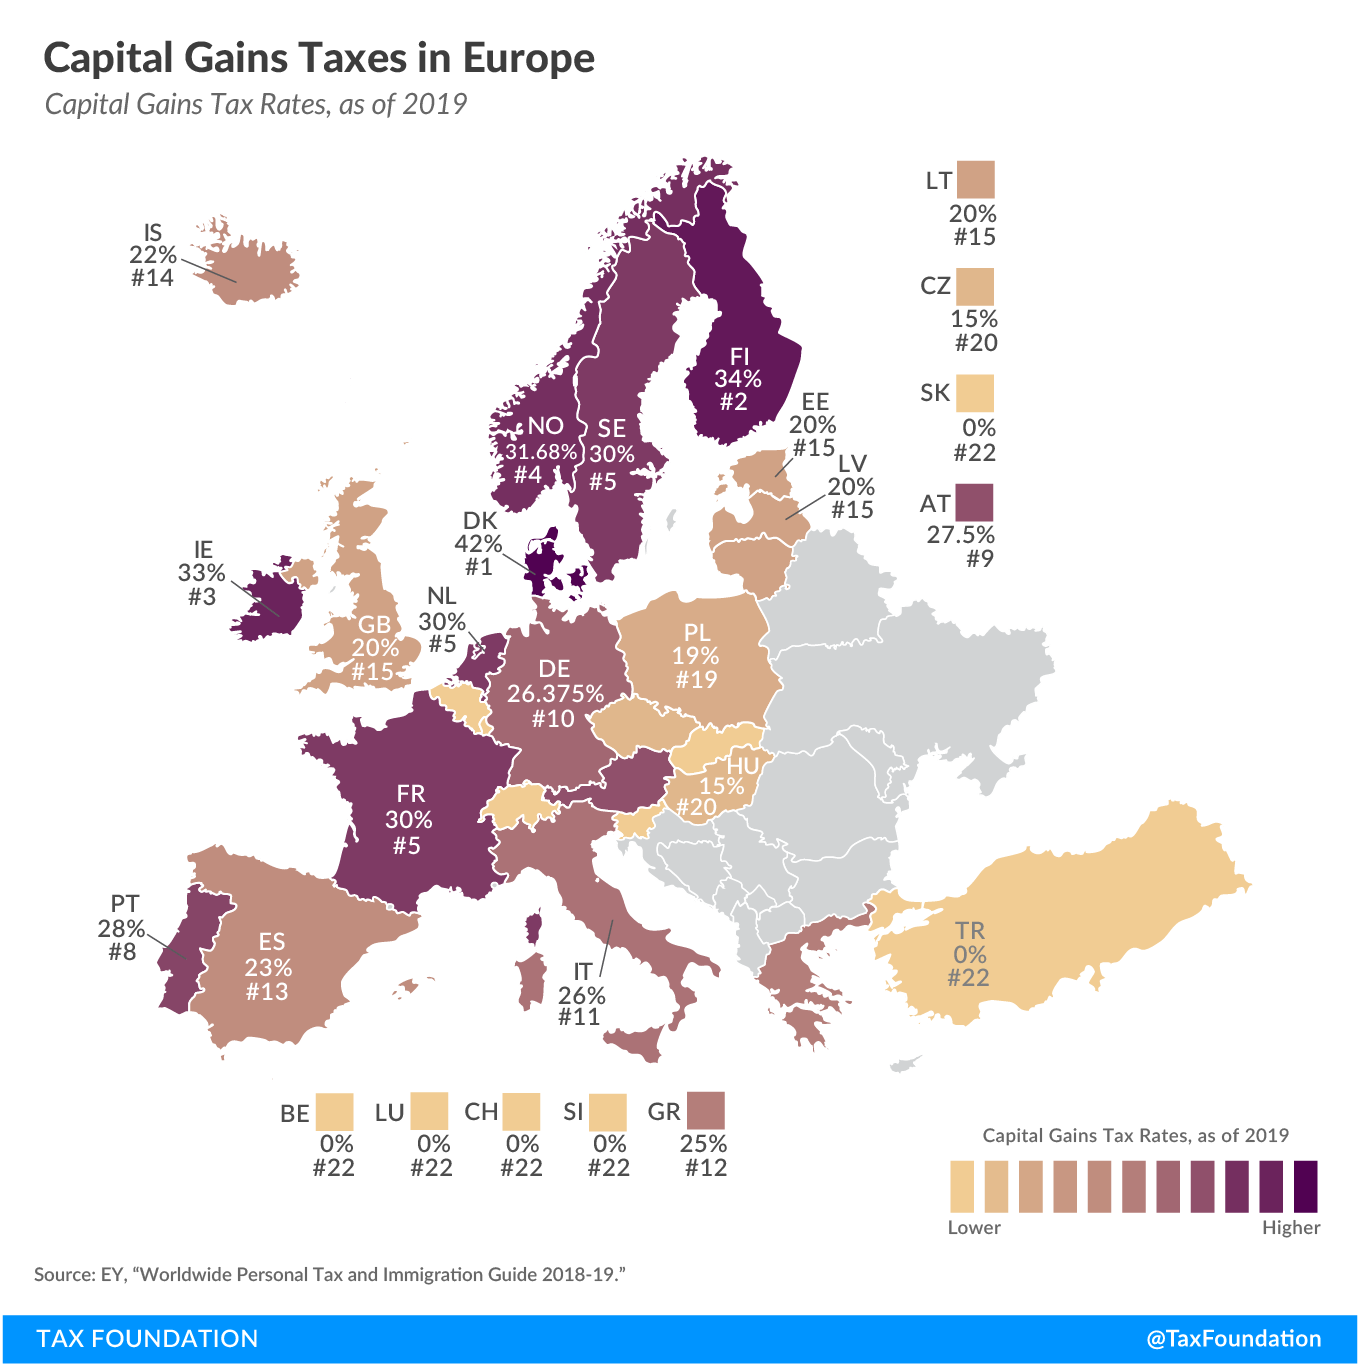
In many countries, investment income, such as dividends and capital gains, is taxed at a different rate than wage income. Today’s map focuses on how capital gains are taxed, showing how capital gains tax rates differ across European OECD countries.

When a person realizes a capital gain—that is, sells a capital asset for a profit—they face a tax on the gain. The capital gains tax rates shown in the map are expressed as the top marginal capital gains tax rates, taking account of imputations, credits, or offsets.

Capital gains taxes in Europe. See capital gains tax rates in Europe.

Denmark levies the highest capital gains tax of all countries covered, at a rate of 42 percent. Finland and Ireland follow, at 34 percent and 33 percent, respectively.

A number of European countries do not levy capital gains taxes. These include Belgium, Luxembourg, Slovakia, Slovenia, Switzerland, and Turkey. Of the countries that do levy a capital gains tax, the Czech Republic and Hungary have the lowest rates, both at 15 percent.

On average, the European countries covered tax capital gains at 19.9 percent.